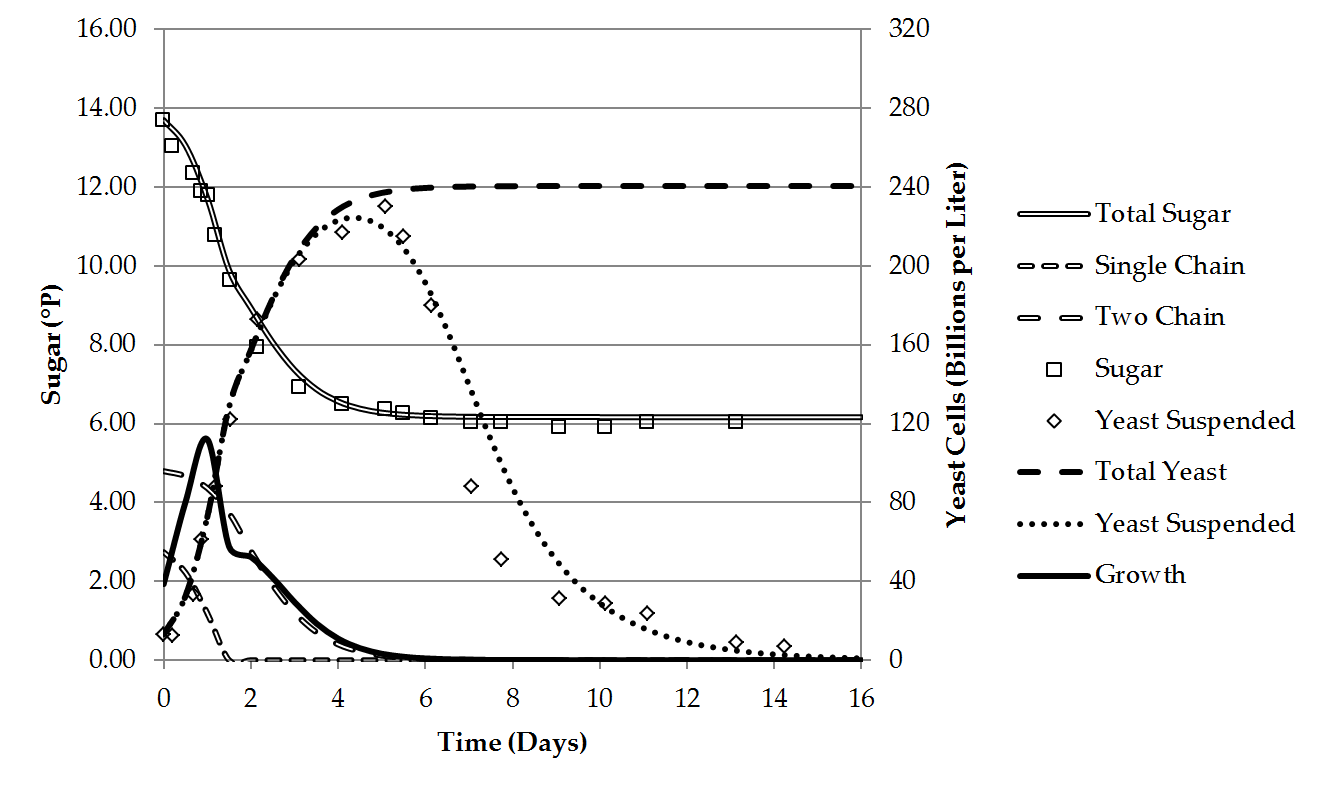
Description of Graph
The lines are generated by the model. The squares and diamonds were measured experimentally. The cells that have an orange background are intended to be changed.
Total Sugar - Sugar concentration in degrees Plato (multiply by 4 to get brewers points)
Single Chain - Component of Total sugar that is simple sugar
Two Chain - Component of Total sugar that is more difficult to ferment 2 chain sugar.
Sugar - Measured sugar (Refractometer corrected for alcohol)
Yeast Suspended - Billions of cells per liter (as counted on a hemocytometer)
Total Yeast - Calculated total yeast population
Yeast Suspended - Calculated yeast remaining in suspension (note that this is highly strain dependent, but can be adjusted in the model)
Growth - Billions of cells grown per day.
My book goes into more detail about the application of this model and how this graph can be used to better understand yeast growth.
 Yeast Growth Fermentation Model Download